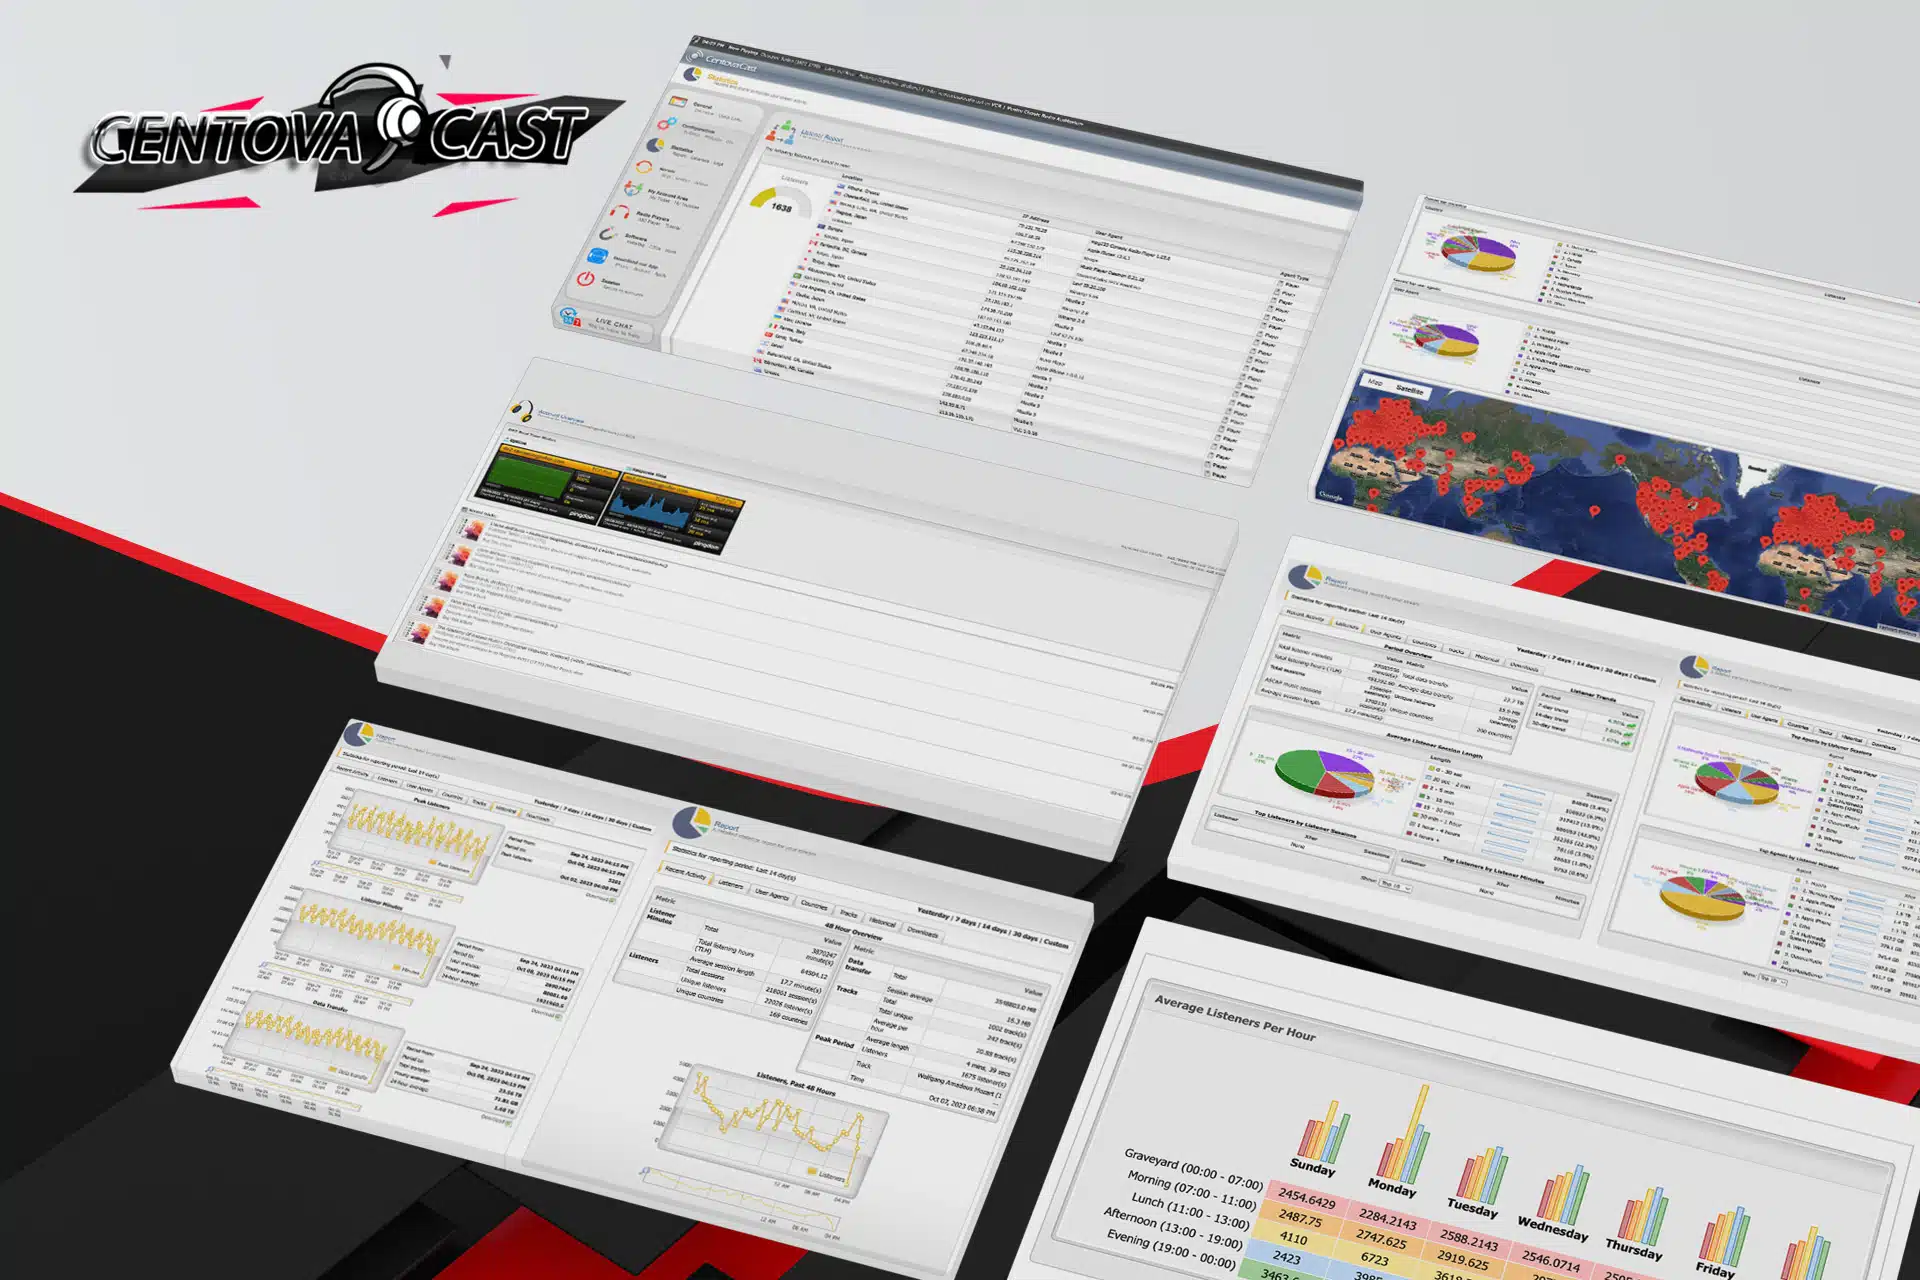
April 28, 2024 Centova Cast Statistics Organize your media seamlessly with Centova Casts Media Library. Read more
April 27, 2024 Centova Cast Library Organize your media seamlessly with Centova Casts Media Library. Read more
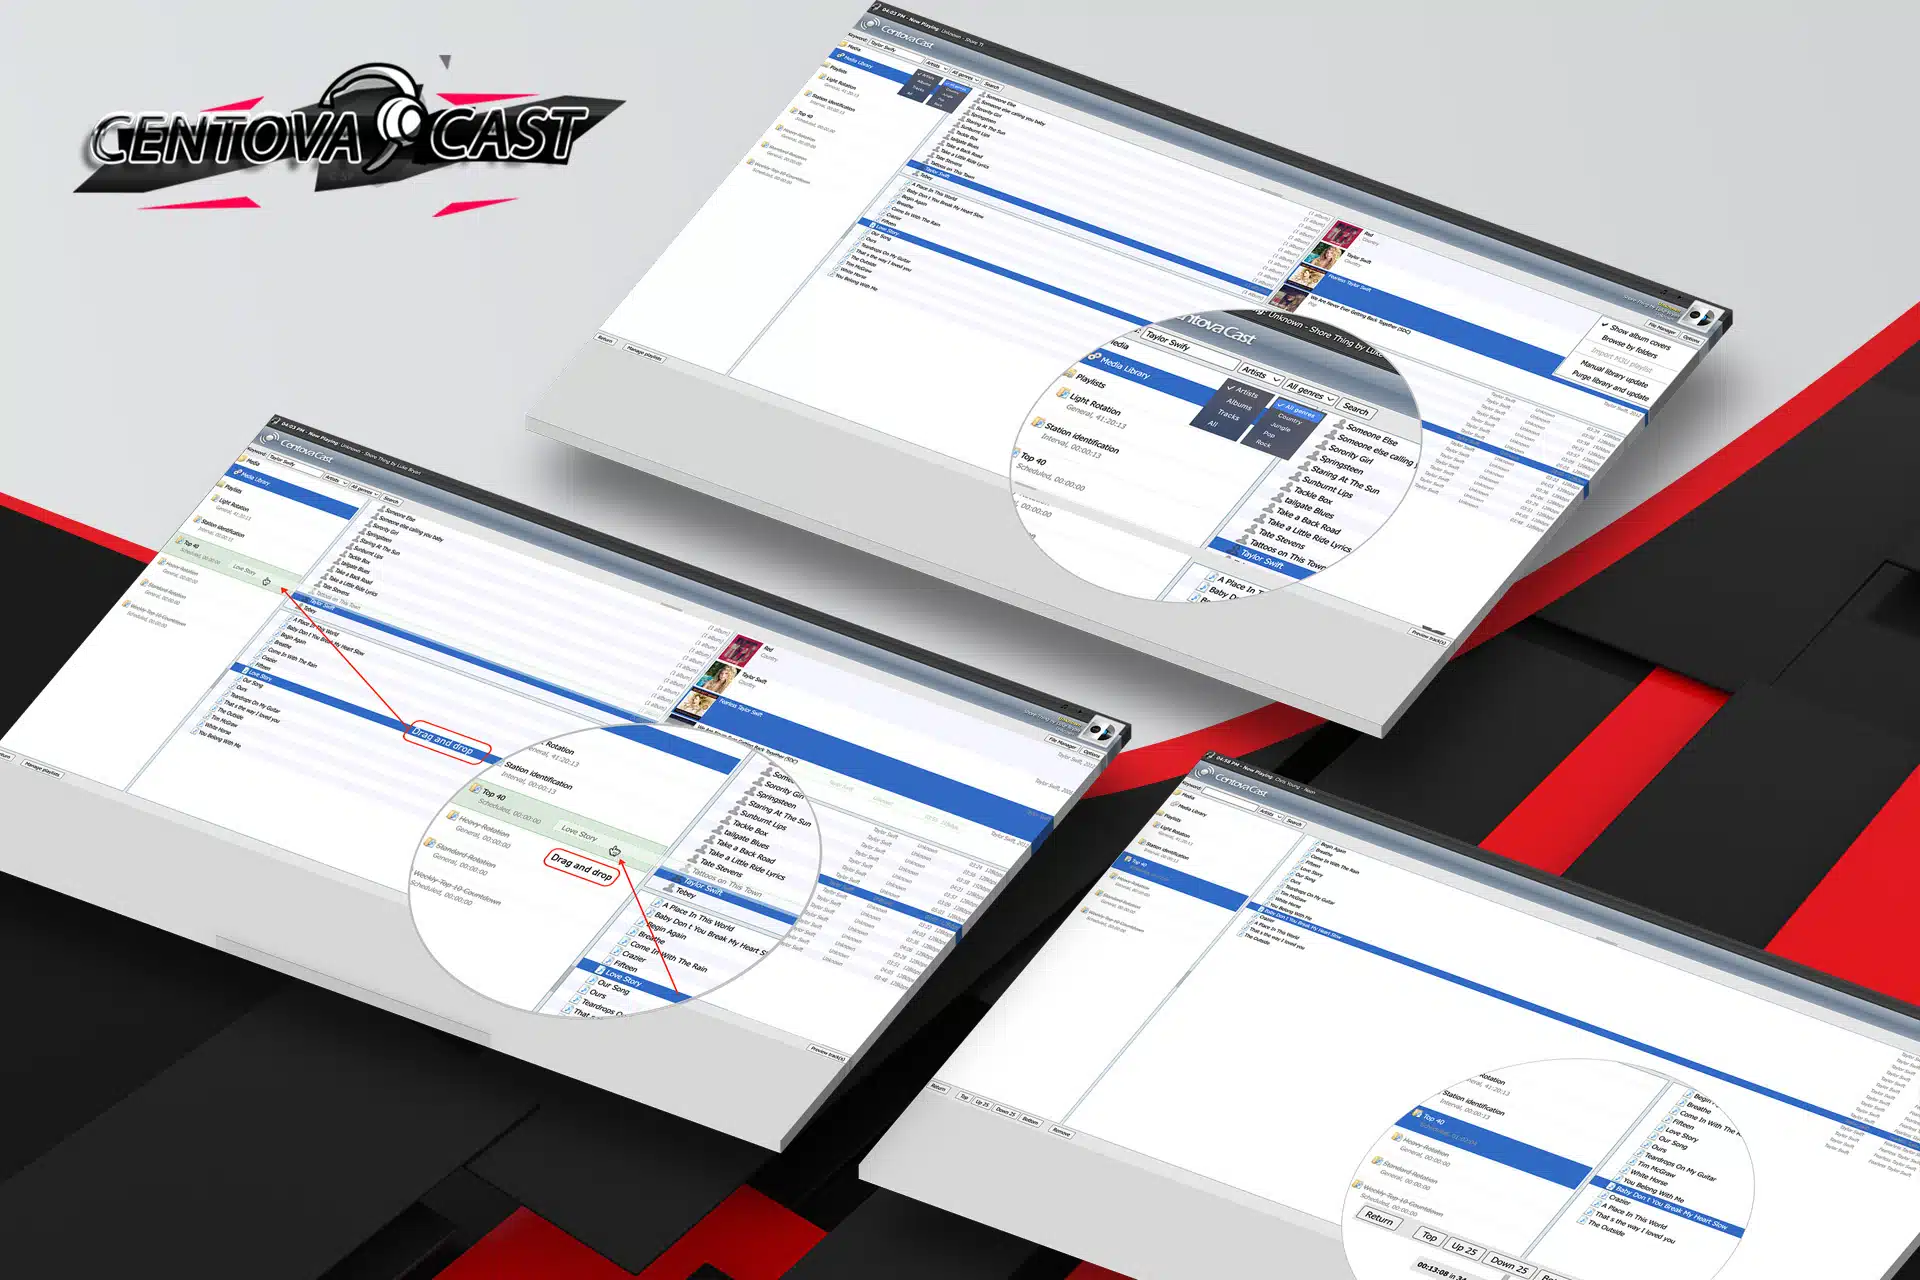
April 27, 2024 Centova Cast Playlist Empower your media scheduling with the Playlist Manager. Read more
April 27, 2024 Centova Cast Relaying Relaying another stream, using a remote streaming server. Read more
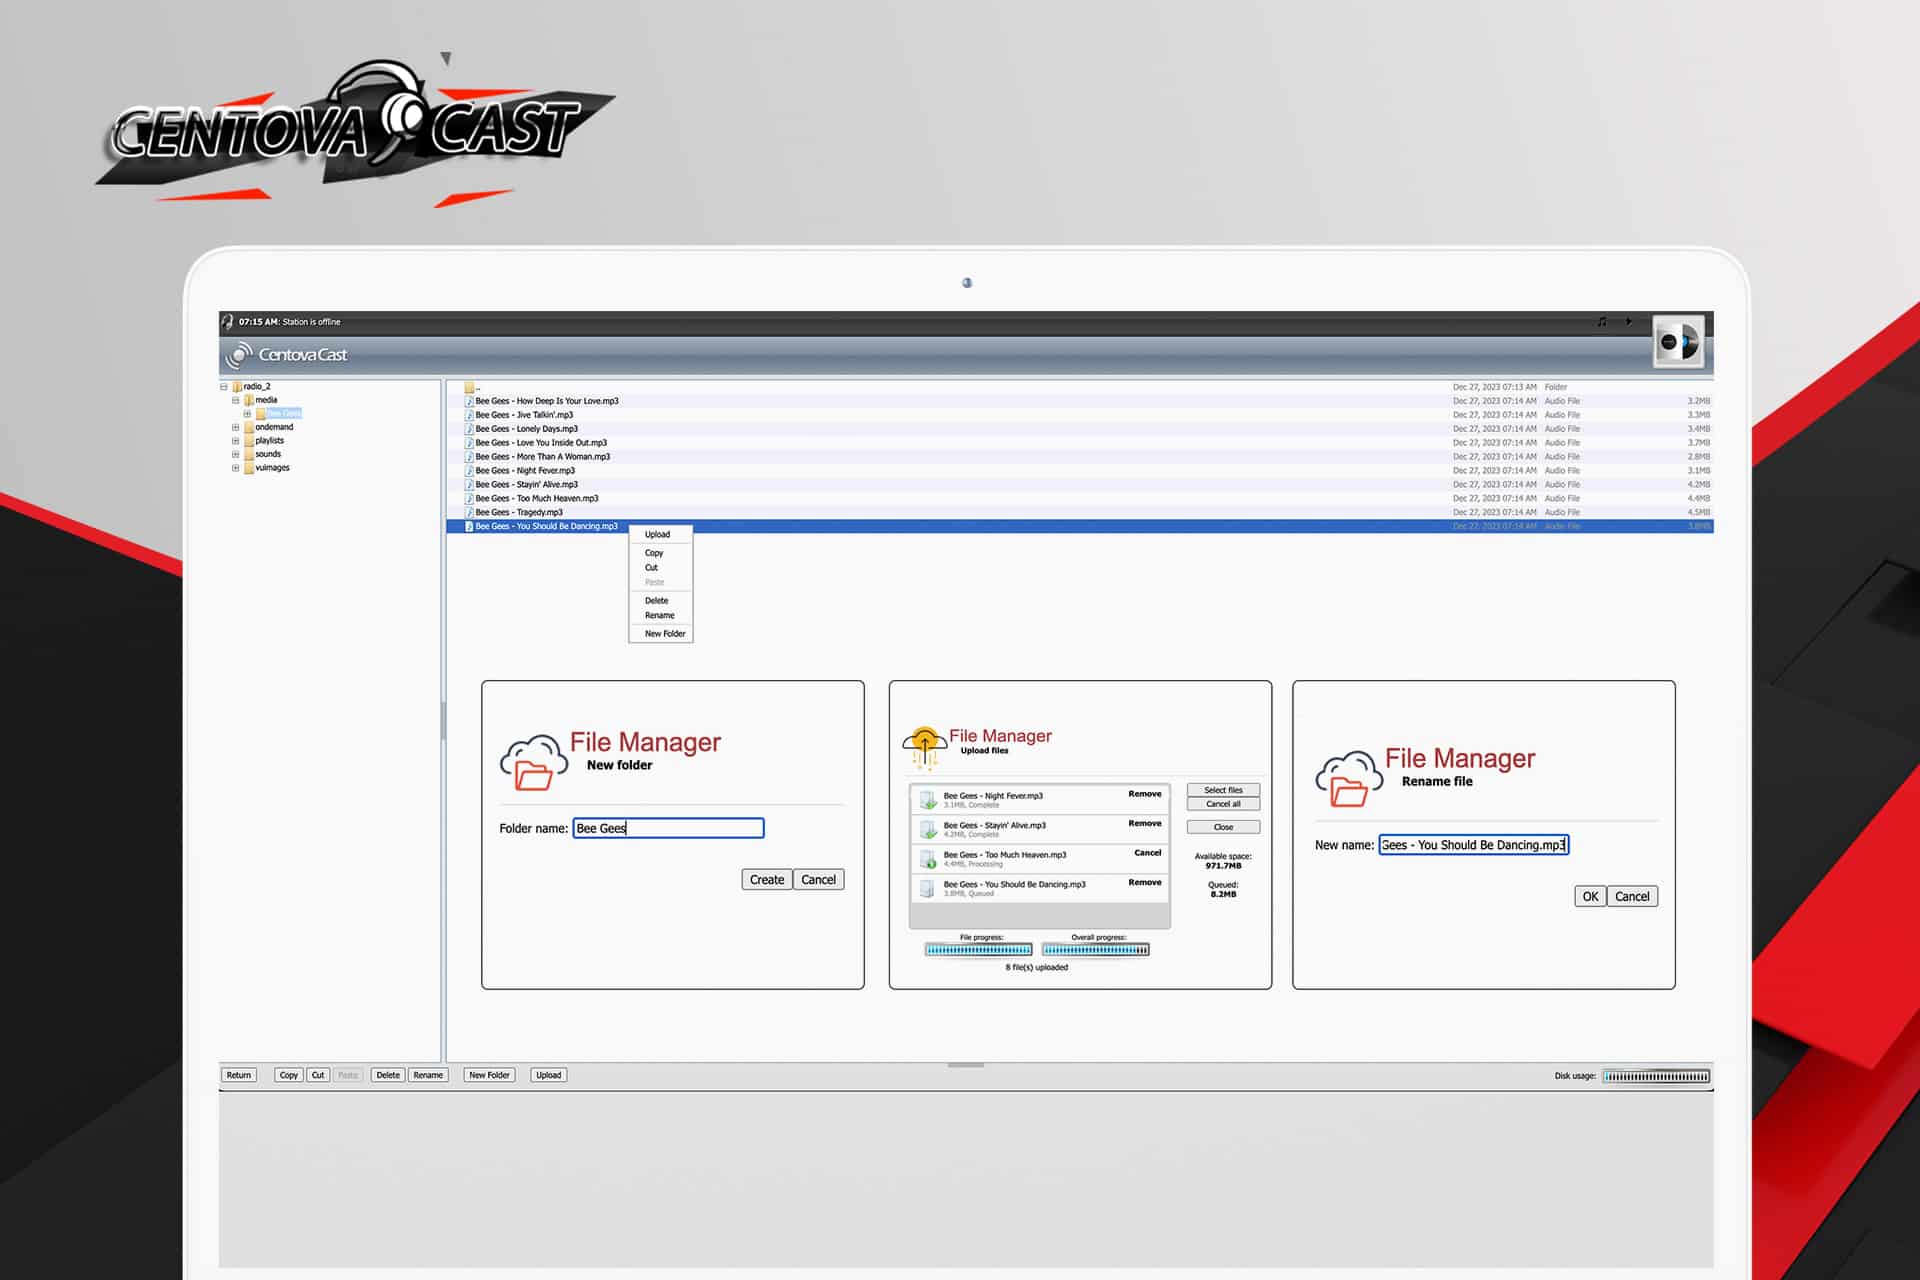
December 27, 2023 Centova Cast File Manager File Manager within Centova Cast offers a comprehensive interface. Read more
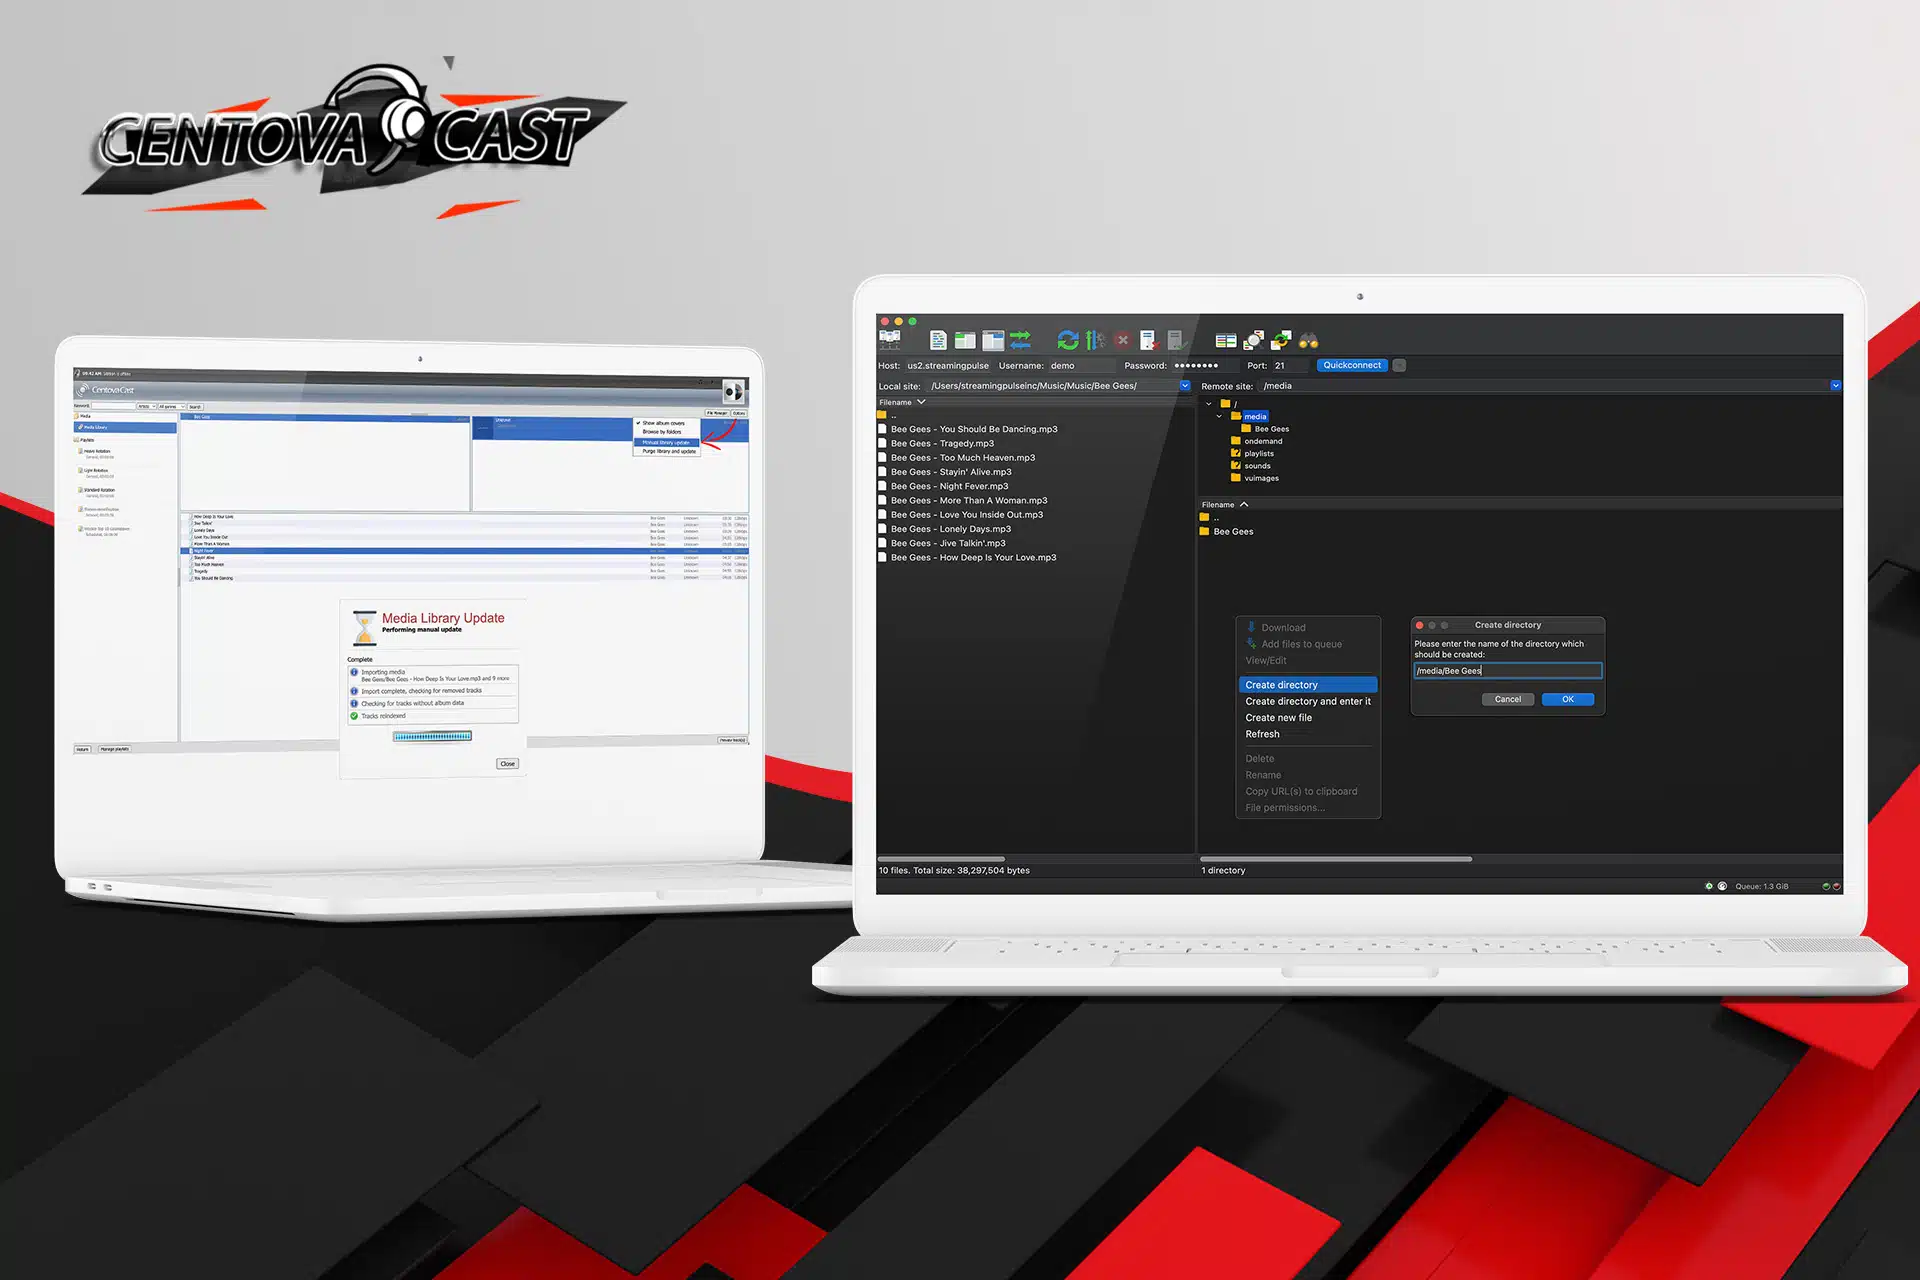
December 25, 2023 Centova Cast FTP The DJ manager allows you to create and configure DJ accounts. Read more