Unleash the Power of MojoCP Analytics
Seamless Server Monitoring
Effortlessly oversee server connections and application statistics with MojoCP, ensuring a smooth monitoring experience. In addition, all timestamps show in the user's local time for easy reference. Furthermore, MojoCP changes these timestamps to Coordinated Universal Time (UTC), allowing you to accurately capture and analyze important data related to your server statistics.
Comprehensive Data Recording Strategy
MojoCP collects metrics every five seconds for each application, using a careful data recording strategy. Specifically, the system averages these metrics every minute and keeps them for better analysis of your server statistics. Thanks to this simple approach, MojoCP stores up to 12 hours of 5-second samples at the same time. Moreover, the system keeps per-minute averages for 72 hours, replacing them on a rolling basis. Additionally, hourly averages, which come from minute data, are carefully calculated and stored for 31 days. Meanwhile, daily averages come from hourly data and remain available for up to 365 days.
Consistent and Accurate Timekeeping
MojoCP keeps all timestamps in its database in Coordinated Universal Time (UTC), ensuring accuracy and consistency in record-keeping. This uniformity is key for accurately analyzing trends and making smart decisions based on the collected data for your server statistics.
Real-Time Insights
You can trust MojoCP's strong monitoring system to provide accurate, real-time insights into your server connections and application statistics. Moreover, this data helps you spot potential issues before they escalate, ensuring your streaming service stays efficient and reliable. By using these insights, you can improve your server performance and enhance overall broadcasting capabilities.
Conclusion
In summary, MojoCP gives you complete oversight of your server statistics, helping you to improve your streaming services. Thus, you can enjoy the benefits of better monitoring for a superior broadcasting experience. Ultimately, these features lead to a more reliable and efficient streaming operation.
Click to zoom in on the image
Empowering Insights with MojoCP:
Elevate your streaming experience with Streaming Pulse, a dynamic platform fortified by MojoCP advanced analytics suite. Dive into a world of insightful monitoring and reporting, designed to empower streamers of all levels.
Statistics Reporting Period:
Streaming Pulse, backed by the MojoCP platform, introduces the Statistics Reporting Period feature, empowering users to generate insightful reports on their streaming system's usage patterns over specific time intervals. Choose your reporting period, spanning the past 7 days, current month, or the previous month, and gain valuable insights into viewer count, network throughput, and disk usage. This feature aids in making informed decisions for resource allocation and optimizing overall streaming system performance.
Custom Statistics for Reporting Period:
Dive deeper into your stream's dynamics with custom statistics tailored to your reporting needs. From real-time data for the last hour to comprehensive insights over the past 365 days, this feature allows you to analyze maximum, average, and minimum statistics, providing a nuanced understanding of your streaming system's performance. Tailor the displayed data to your precise needs by choosing a predefined date and time range from a comprehensive list. Specify the specific date and time parameters, empowering you to access the information relevant to your desired timeframe.
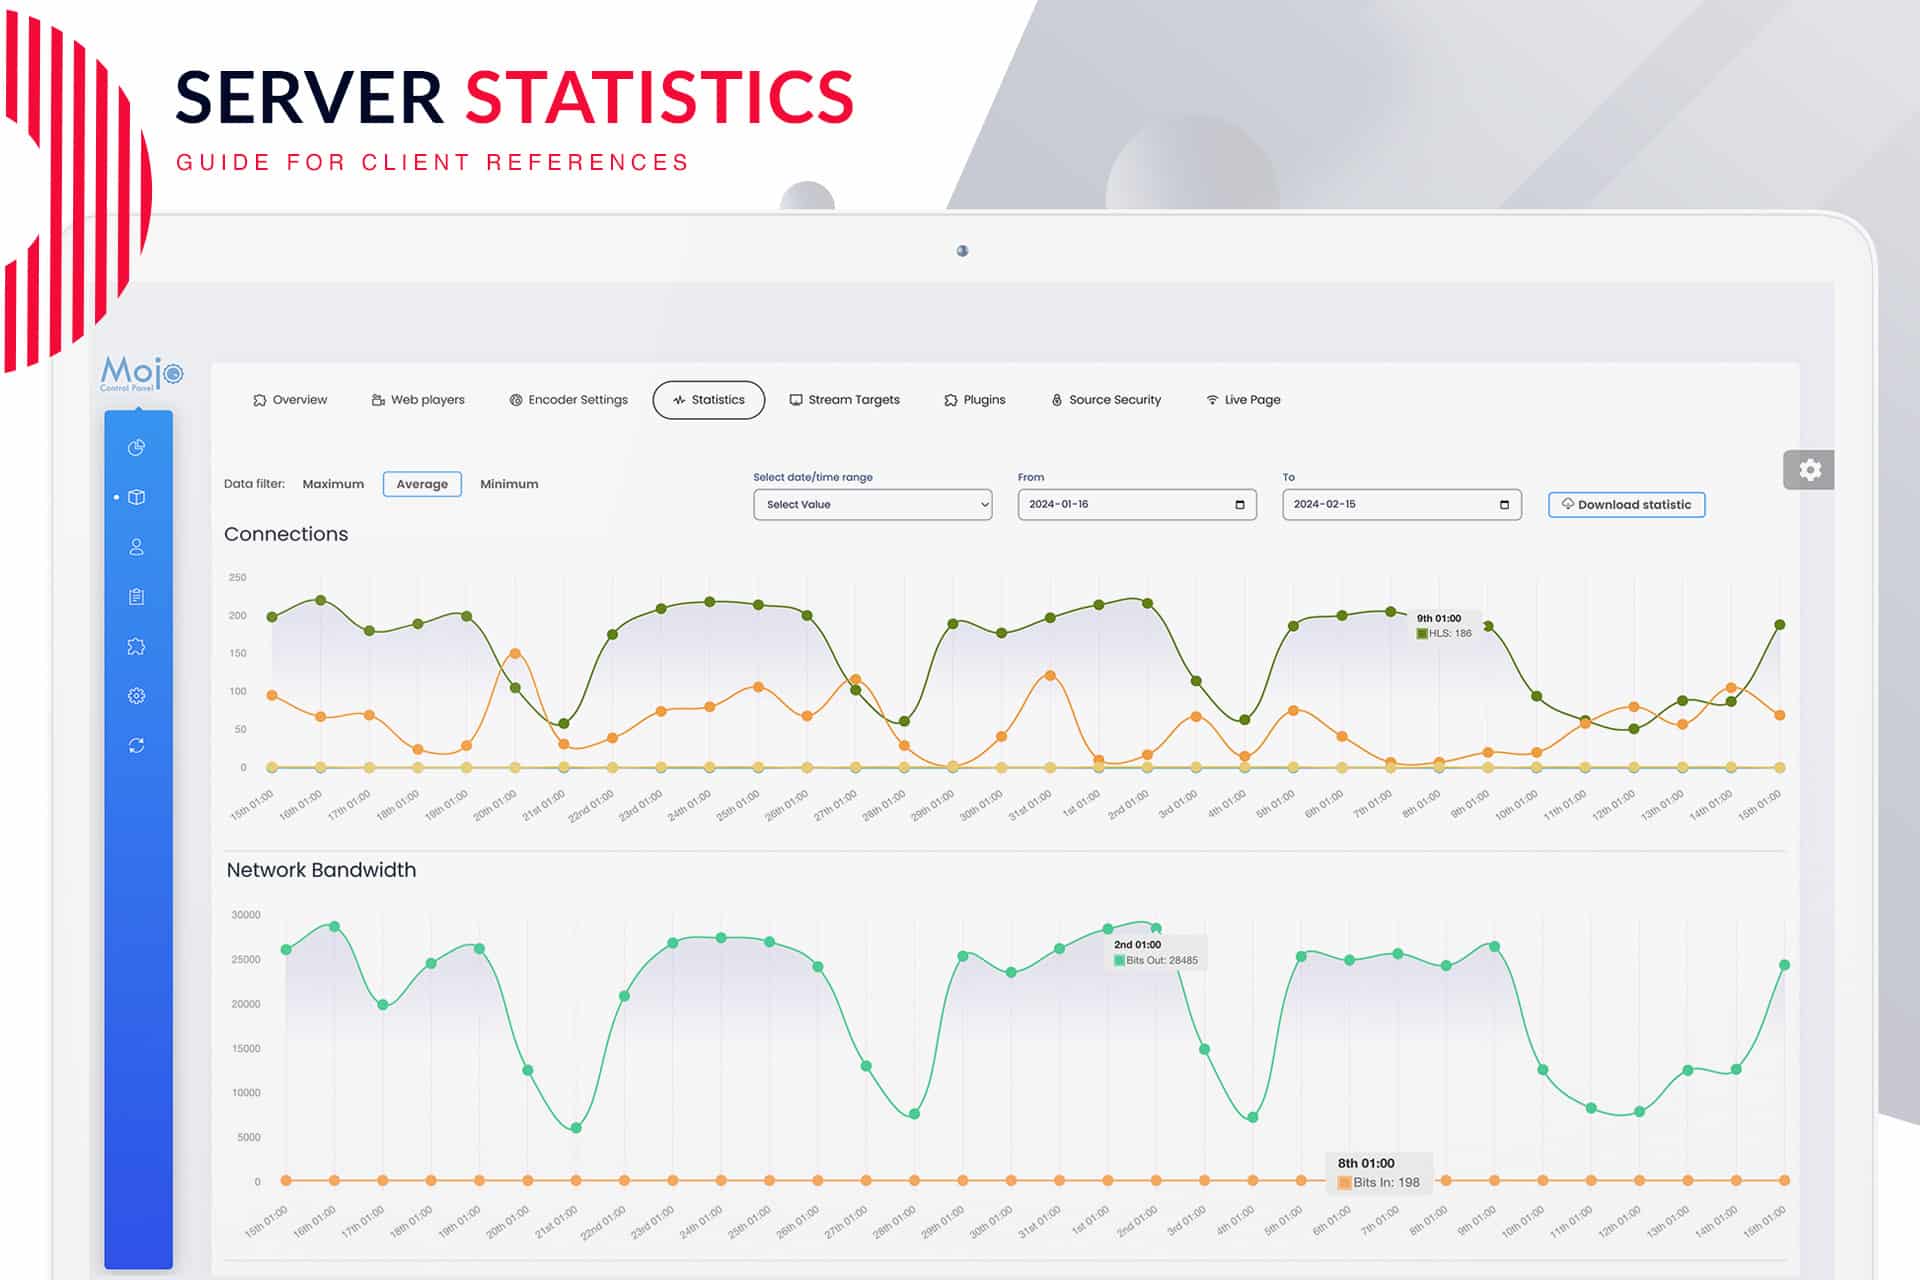
Connections Per Protocol:
Uncover the intricacies of your streaming protocols with the Connections Per Protocol feature. The line chart displays the connection data for various protocols, including RTMP, HDS, DASH, HLS, and RTSP/RTP Smooth, offering a visual representation of historic connection data. This essential tool assists in monitoring protocol performance, identifying usage patterns, and making data-driven decisions for optimal streaming experiences.
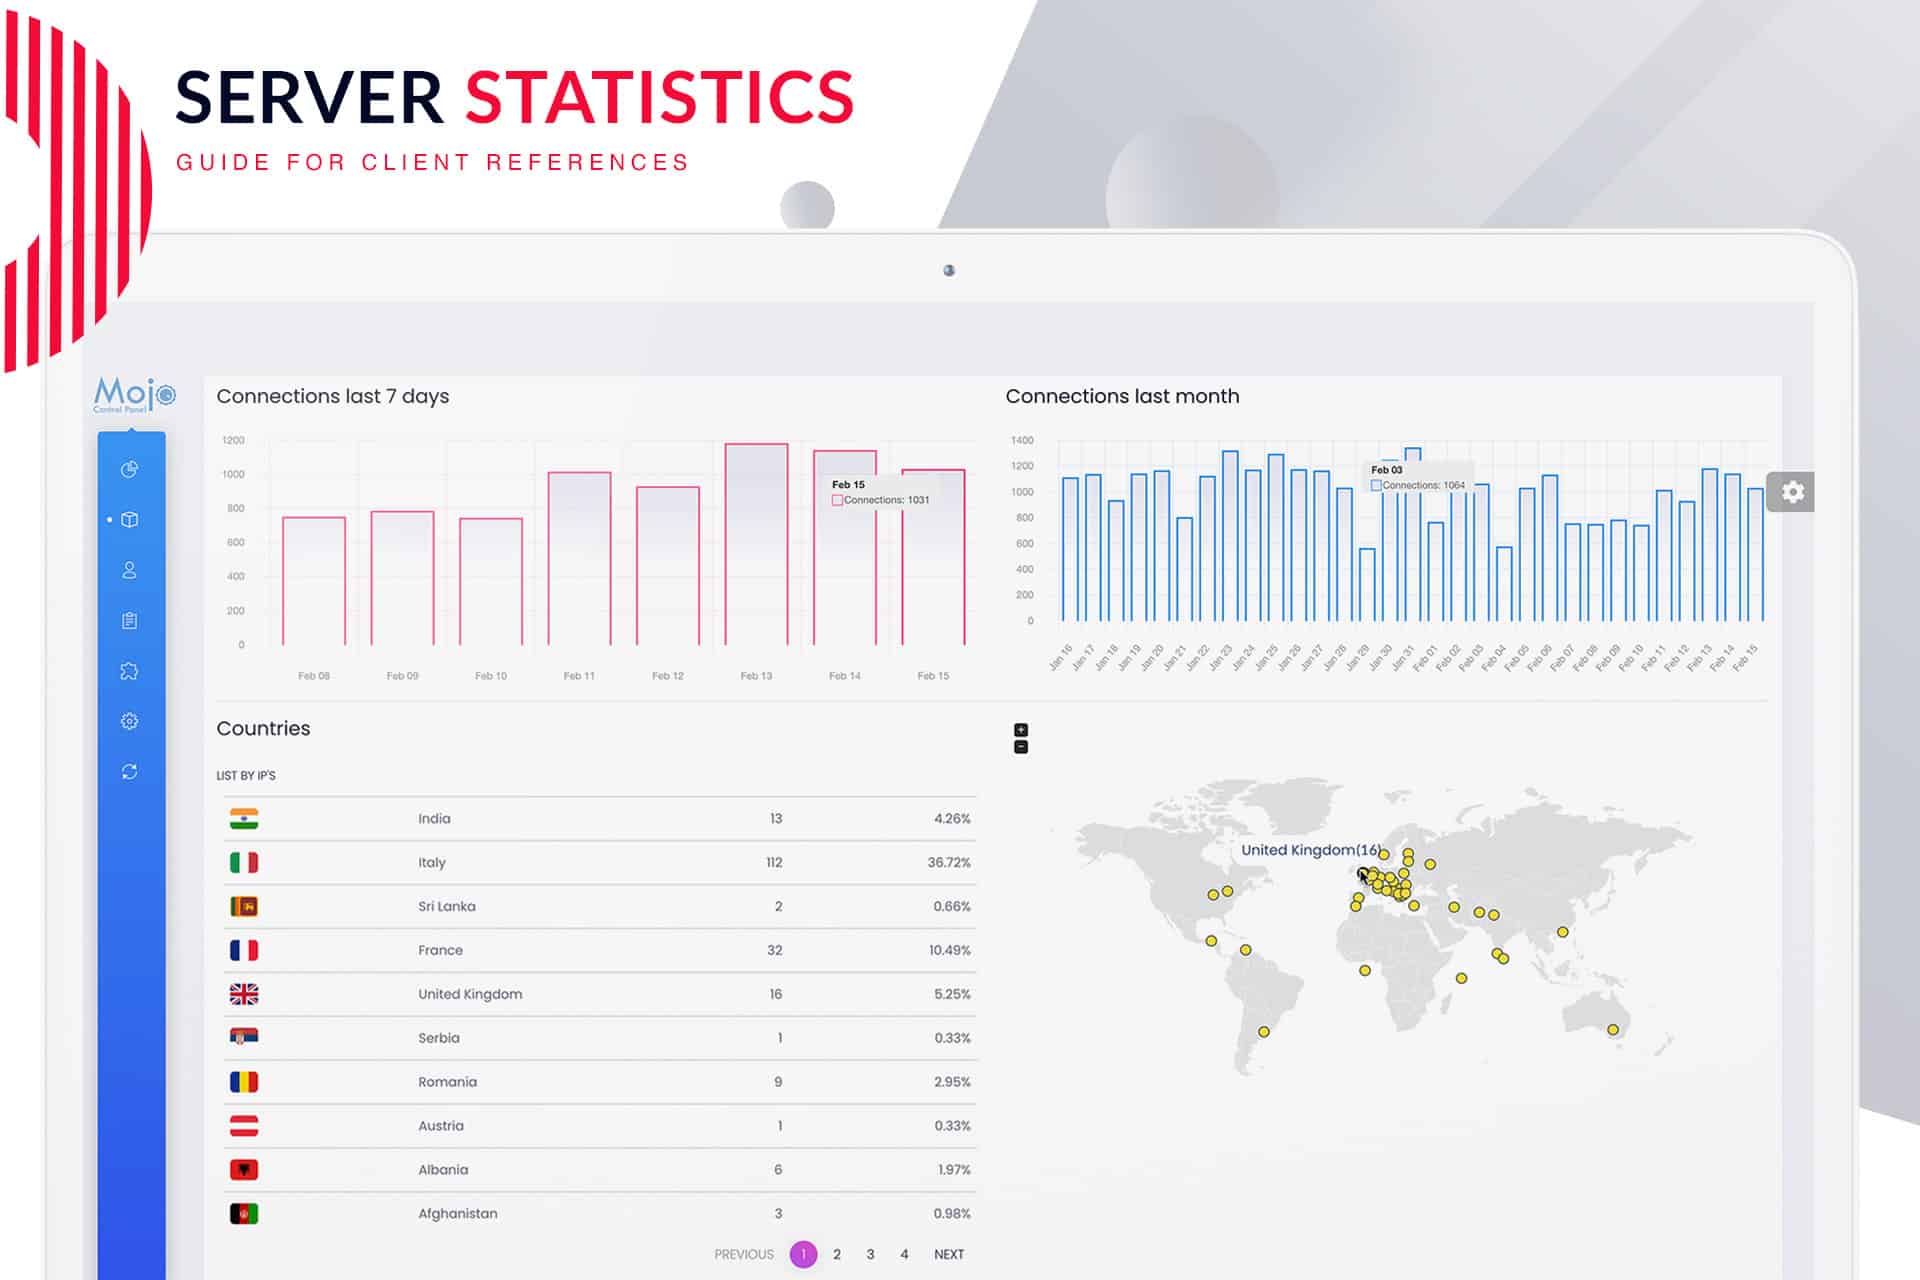
Real-Time Data and Connections Viewers:
Witness the power of real-time insights with Streaming Pulse. Track real-time data, connections, and viewers to understand trends and patterns over weekly and monthly periods. Whether it's analyzing network bandwidth, viewer distribution, or understanding viewer behavior, real-time data and connections viewers are indispensable tools for informed decision-making.
Network Bandwidth Monitoring:
Streaming Pulse, powered by MojoCP, goes beyond conventional network monitoring. Utilizing advanced algorithms, it provides real-time insights into network bandwidth usage, both incoming and outgoing. With detailed reports and graphs, administrators can identify trends, potential bottlenecks, and make informed decisions about network infrastructure upgrades.
Top Countries by Viewers - Countries & Map:
Visualize your global audience with the "Country Map" feature on MojoCP. Dynamically displaying viewer distribution across countries, this visual representation offers real-time insights into audience demographics. A valuable tool for businesses and content creators, the Country Map feature aids in understanding your audience better and making informed decisions to enhance your streaming strategy.
- Streaming Pulse Inc.
End-to-End Monitoring Solution
Elevate your monitoring experience with an end-to-end solution, ensuring no aspect of your system goes unnoticed. Streaming Pulse, with MojoCP at its core, is your comprehensive solution for monitoring, analytics, and optimization. Stay ahead of the streaming curve, make data-driven decisions, and deliver an unparalleled streaming experience to your audience.
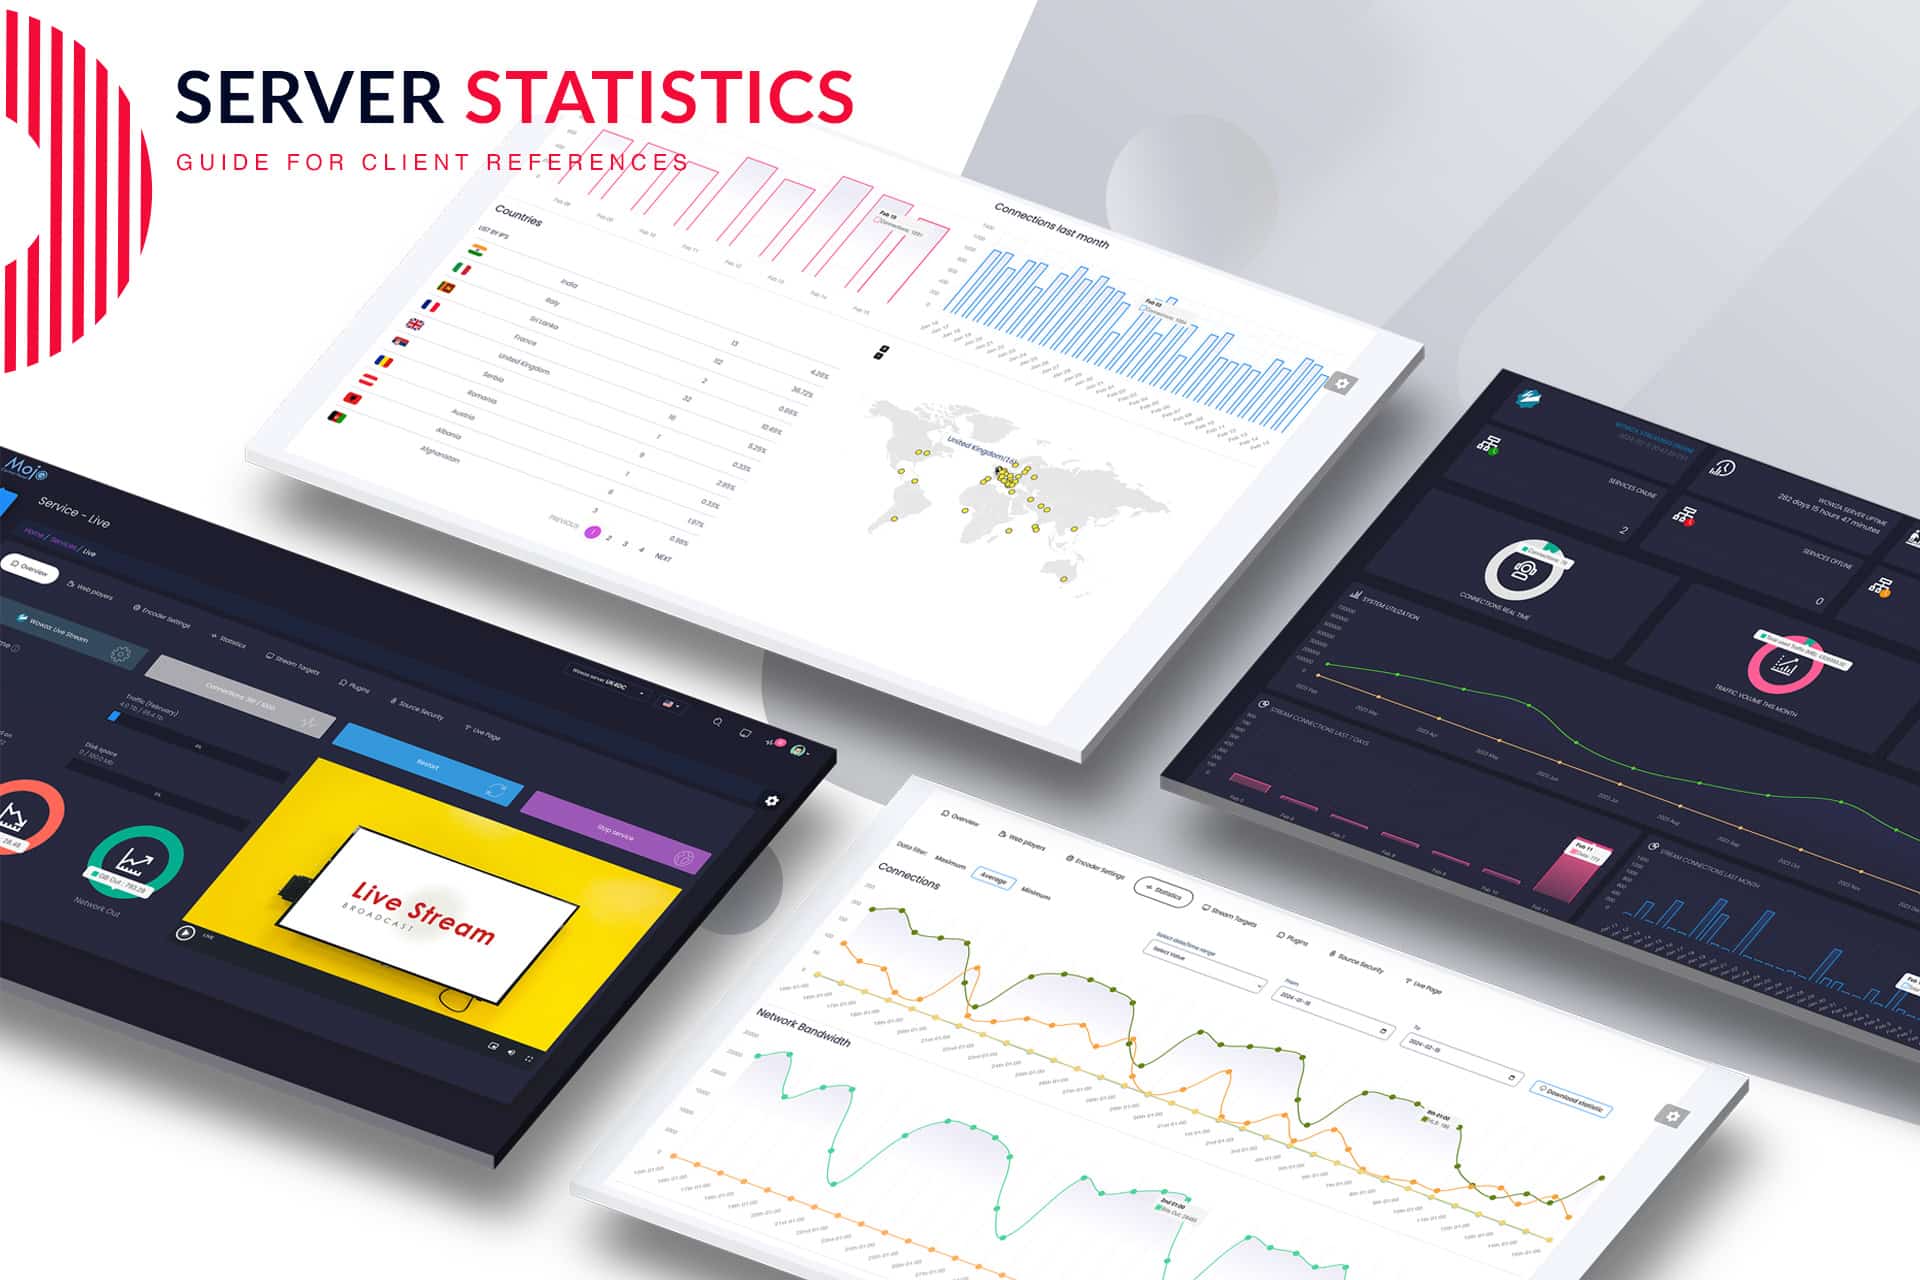
Sophisticated UI Monitoring Mastery
Dive into monitoring mastery with a polished user interface. Streaming Pulse, fortified by MojoCP, offers comprehensive monitoring and analytics to optimize your streaming system for a top-tier audience experience.